How to create the second custom report “ALL USERS BY USER ACTIVITY”:
Note: The code works well on FortiAnalyzer 5.4.3. If you have syntax problems on other versions, review the “Top Web Users by Allowed Requests” report to verify your table and column names.
Create a new dataset named “ALL USERS BY USER ACTIVITY”
Log type = Traffic
Query =
select sum(minutes) as CountTimeStamps, user_src, catdesc, hostname as website, status, sum(bandwidth) as bandwidth from ###(select count(dtime) as minutes, coalesce(nullifna(`user`), nullifna(`unauthuser`), ipstr(`srcip`)) as user_src, catdesc, hostname, cast(utmaction as text) as status, sum(coalesce(sentbyte, 0)+coalesce(rcvdbyte, 0)) as bandwidth from $log-traffic where $filter and hostname is not null and logid_to_int(logid) not in (4, 7, 14) and (countweb>0 or ((logver is null or logver<52) and (hostname is not null or utmevent in (‘webfilter’, ‘banned-word’, ‘web-content’, ‘command-block’, ‘script-filter’)))) group by user_src, catdesc, hostname, utmaction)### t group by user_src, catdesc, website, status having sum(minutes) > 1 order by user_src, CountTimeStamps DESC
Apply…
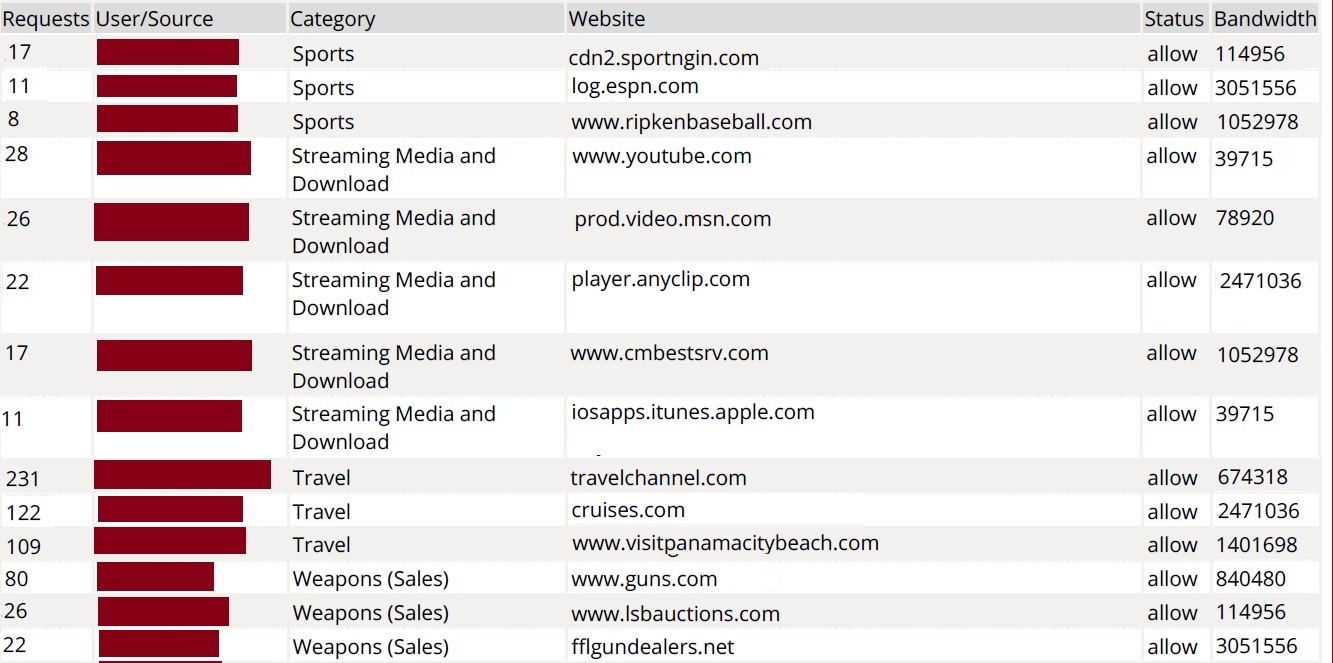
Create a new Chart named “ALL USERS BY USER ACTIVITY”
- Select dataset = ALL USERS BY USER REQUESTS
- Resolve hostname = Inherit
- Chart type = table
(The columns should auto-populate)
- Change counttimestamps to “Requests (minutes”) and width = 5%
- Change user_src to “User/Source” and width = 14%
- Change catdesc to “Category” and width = 20%
- Change website to “Website” and width = 0%
- Change bandwidth to “Bandwidth” and width = 6% and change the binding to “Bandwidth (KB/MB/GB)”
- Order by = unchecked
- Show Top (0 for all results) = 0 **Double check this one**
Apply…
Create a new FortiAnalyzer report:
Create from Blank, named “ALL USERS BY USER ACTIVITY”
Go to Layout tab >
Insert Chart >
- Select the ALL USERS BY USER ACTIVITY chart.
- Title = Default
- Width = 700
Filters = (Click + to add a filter)
- Log Field = Category Description (catdesc)
- Match Criteria = Not Equal To
- Value = type “Advertising” and press Enter. Now add the rest of the categories, pressing enter between each one.
- Advertising
- Reference
- Information Technology
- Search Engines and Portals
- Web Hosting
- Business
- Government and Legal Organizations
- Information and Computer Security
Apply and run the report using the last 10 hours or so. This report is first ordered by User, then by number of requests (indicating the most browsed sites).
Note: If you have more than 10,000 lines in the report, it will cut off. Report across fewer hours if this happens.
Hope you found this blog useful! Kieri Solutions can create other custom reports for you as well. We would be glad to send you a free estimate. Thanks!
hello,
I run your script but I have an error (ERROR: column “‘webfilter'” does not exist
LINE 1: … ver <52) and (hostname is not null or utmevent in ('webfilt …). Can you help me my version is FortiAnlyzer-1000c v5.4.3 build1187
Hi Claude,
Hmmm. Could be syntax (like missing a parenthesis), or the slight difference in version could have removed or renamed the ‘webfilter’ column in the underlying database.
I would try just removing ‘webfilter’, from the query, and seeing how it comes out (or if you get a new error).
The ultimate answer is that you can reverse engineer FortiAnalyzer by looking at existing, working queries such as “Top Web Users by Allowed Requests”. Compare the parts of the queries to each other (such as the (‘webfilter’, syntax and see if it is slightly changed in the working code.
Check the quotes, copy and paste brings in the single quotes wrong on my setup. Once I corrected the single quotes, all worked fine.
Same as Claude I get an error when testing the query. Quotes come in as single quotes (same as what is in the source code above). I’m running version 5.4.4 … can anyone offer any insight?
If you are having trouble, my best suggestion is to look at the code for the canned dataset “Top Web Users by Allowed Requests”. It is very similar to this custom report (the custom report adds grouping and some filters so that you don’t have to look at 20,000 individual rows). Use this as your base code (copy into notepad etc) and modify it manually. This should prevent syntax or copy-paste issues.
Apparently the dataset query must use single quotes ‘ when doing the IN clause:
select sum(minutes) as CountTimeStamps, user_src, catdesc, hostname as website, status, sum(bandwidth) as bandwidth from ###(select count(dtime) as minutes, coalesce(nullifna(`user`), nullifna(`unauthuser`), ipstr(`srcip`)) as user_src, catdesc, hostname, cast(utmaction as text) as status, sum(coalesce(sentbyte, 0)+coalesce(rcvdbyte, 0)) as bandwidth from $log-traffic where $filter and hostname is not null and logid_to_int(logid) not in (4, 7, 14) and (countweb>0 or ((logver is null or logver 1 order by catdesc, CountTimeStamps DESC
My comment got cut of. Sorry about that.
To fix the error, just substitute the opening and closing quotes with a single quote( ‘ for ‘ ). Note that they look almost the same.
Original
in (‘webfilter’, ‘banned-word’, ‘web-content’, ‘command-block’, ‘script-filter’)
Fixed
in (‘webfilter’, ‘banned-word’, ‘web-content’, ‘command-block’, ‘script-filter’)
Ok I see. This website substitutes all single quotes with opening and closing quotes.
Yep, between browsers and website and cut-and-paste to MSWord vs Notepad vs Wordpad etc, the unicode changes a bit. But I think your comments will lead everyone in the right direction. Thank you! Amira
I got the scrip running writing the quotes, but when I generated the report, but it end up with a pdf with just “No matching log data for this report”
Hi J,
Do you get data for other reports? Fortianalyzers default to collecting a very small (a few hours) amount of data. Check my other blog on this topic: https://www.kieri.com/fortianalyzer-disk-quota-problem/
hi
when i add the filters the error message show is :
Duplicate log fields (catdesc) are not allowed in filters
Elyas,
You can’t have multiple lines for the Log Field, but you can add multiple Values. Instead of a line for Advertising, a line for Reference, and a line for Information Technology, you’ll have one line for value “Advertising, Reference, Information Technology”. Hover over the ? behind “Value” to see instructions.
Hope that helps!
Thanks. Really Helpful.
thanks for posting this blog really useful
I wanna make a report for a source ip full browsing log, Anyone tell me procedure.
Is it possible to create data query in fortianalyzer like this :
User (or IP) Bandwidth Category Site Browsing Time(hh:mm:ss)
if possible please help me anyone